- Overview
- Infographics
- Technical Notes
Background
Climate change is increasing the frequency, severity and geographic impacts of extreme heat events [1]. Extreme heat days are typically defined as days with hotter and/or more humid weather, compared to normal; definitions can vary based on temperature alone or the heat index (a combined measure of temperature and humidity) [2-4]. In early summer of 2025, a heat dome brought dangerous levels of heat across many parts of the United States, with over 100 million people exposed to extreme heat during each day of that heat wave [5]. These types of heat events can cause especially serious health problems for pregnant women and their babies.
Previous research has linked pregnancy heat exposures to increased risks of severe maternal morbidity[6], pregnancy and delivery complications, and delivering a preterm or low weight baby requiring specialized NICU care [7-9]. Despite these serious health risks of extreme heat, only 31% of Americans in a recent survey identified that heat waves or extreme heat can cause pregnancy complications, highlighting the general lack of awareness of this public health threat [10].
Furthermore, about one-third of counties in the United States are identified as “maternity care deserts” [11], with lack of access to prenatal care associated with increased risk of preterm birth [11] and with higher maternal mortality [12]. Extreme heat only worsens this problem by increasing the number of dangerous heat days [13], exacerbating health risks for both the pregnant mothers and their babies [14]. Having access to a neonatal intensive care unit (NICU) that can provide care for babies with critical conditions has been shown to be effective in improving outcomes among high-risk infants [15, 16]. Therefore, access to NICU care may help mitigate some portion of the risk posed by extreme heat. Moreover, extreme heat health impacts are largely preventable, so implementing solutions to improve heat resilience will help avert many of these serious health outcomes [1]. This data brief summarizes our work to identify areas in the continental United States that have a high risk of extreme heat exposure and low access to NICU care; such areas would be considered the highest risk areas to experience pregnancy heat complications, and also areas of highest priority to implement heat illness prevention programs.
Definitions
We defined current extreme heat exposures based on the annual average number of days from 2019-2023 with a Heat Index above the 95th percentile for that county, compared to a baseline time period (1981-2010). We categorized extreme heat exposures into 5 levels, defined in Table 1.
Table 1. Extreme Heat exposure definition
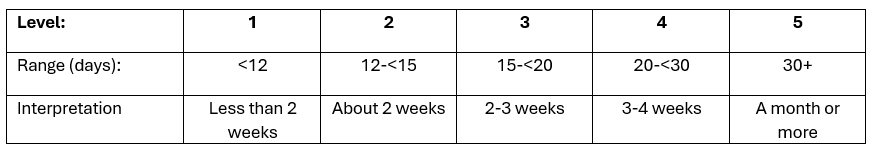
An additional measure of future extreme heat days was calculated as the sum of the current extreme heat days and the projected number of additional days with temperatures over 95°F when the 1.5°C global warming level (GWL) is reached. These predicted temperatures are modeled for each county, as provided in the National Environmental Public Health Tracking Tool [17]. Of note, the measure of projected additional heat days is based on temperature only, so it is not quite the same as the measure of number of heat days from 2019-2023, which is based on both temperature and humidity (Heat Index).. Therefore, we consider this combined measure of future extreme heat days as an approximate estimate of extreme heat exposures in the future.
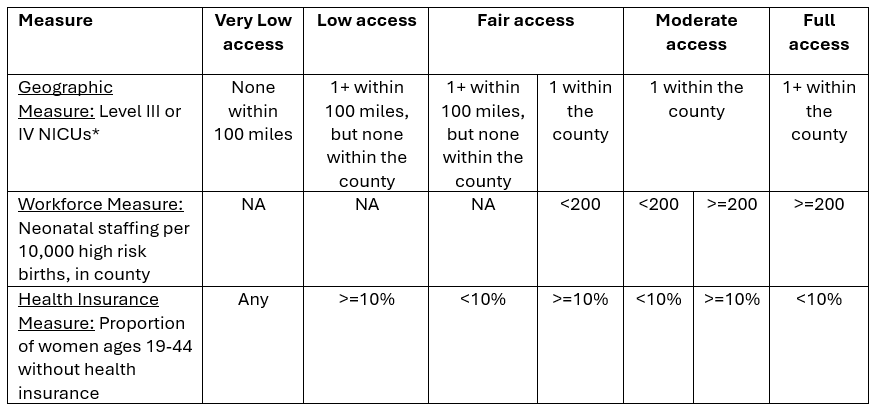
To assess availability of NICU services, we developed a NICU Access Score, which included measures of facility locations, neonatal staffing availability, and health insurance (Table 2). Together, these measures reflect geographic accessibility, workforce availability, and financial accessibility of NICU care. This scoring system was loosely modeled on the Maternity Care Deserts indicator scoring, which focused on obstetric care [18].
Table 2. NICU Access Score definitions
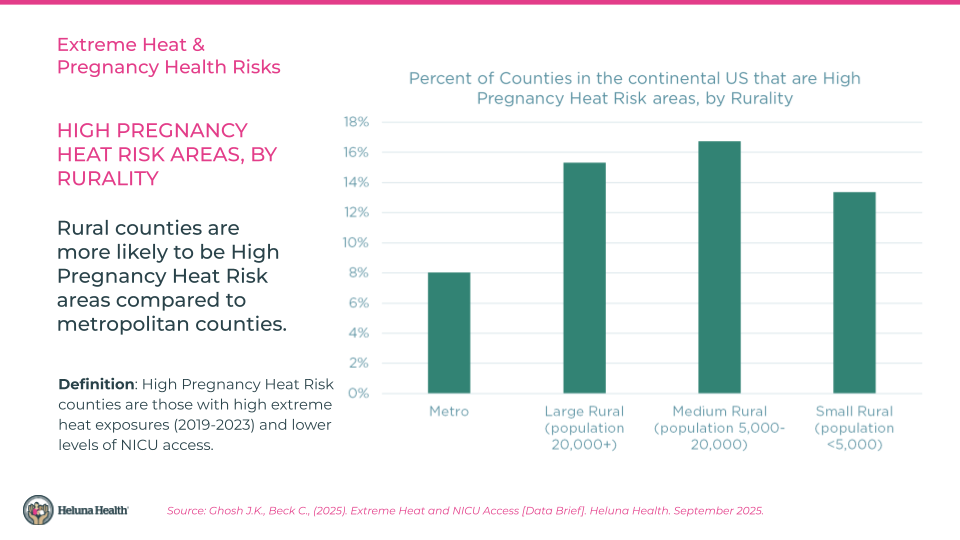
High Pregnancy Heat Risk was defined as having Very Low or Low NICU access and either Level 4 or 5 of extreme heat exposures.
Key Findings
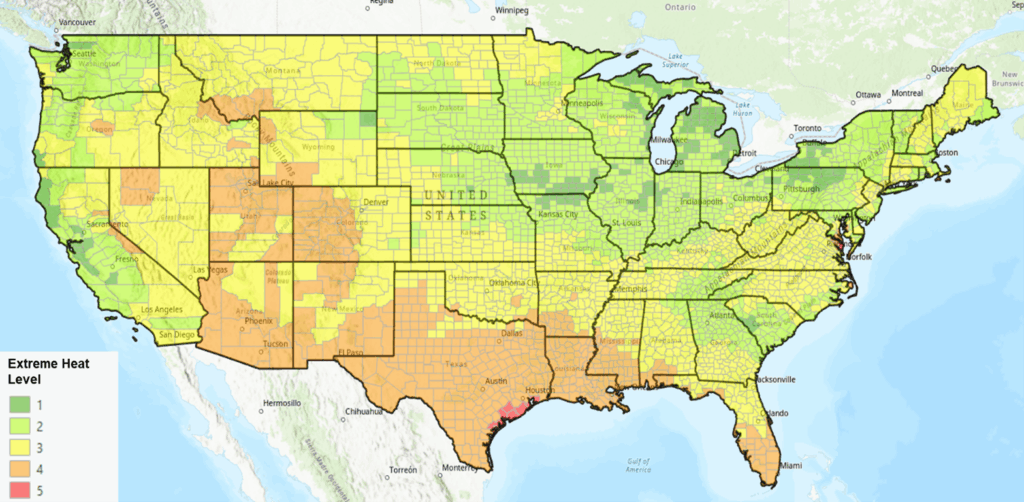
- Extreme heat impacts in the Southeast, South Central, Southwest, and Mountain West states: 513 counties (16.5%) experienced 20 days or more of extreme heat each year between 2019-2023 (Extreme Heat Levels 4 and 5). Most of these counties are in the south and southwestern portions of the United States, along with some counties in the mountain west. Large portions of Texas, Louisiana, Arizona, New Mexico and Mississippi experience this high level of extreme heat.
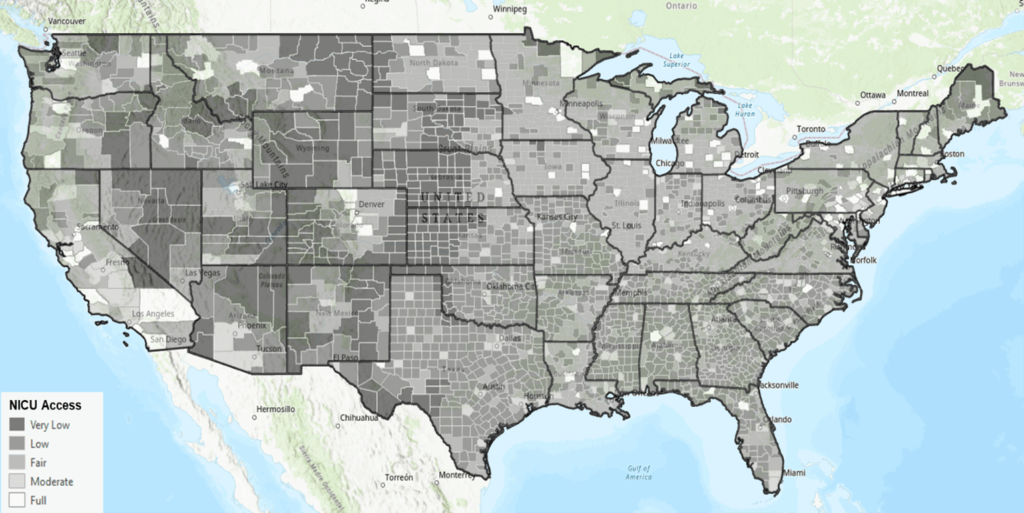
- Low levels of NICU access: More than half the counties have Very Low (9.2%) or Low access (45.1%) scores for NICU access. In other words, 285 counties do not have a NICU within 100 miles of the county centroid (Very Low access) and 1400 counties have a NICU within 100 miles of the county centroid but also have high rates of uninsured women of childbearing age (Low access). Many of these Very Low or Low NICU access counties are in the Southeast, South Central, Southwest,Mountain West and Great Plains regions, although there are counties in all U.S. regions that have Low or Very Low NICU access.
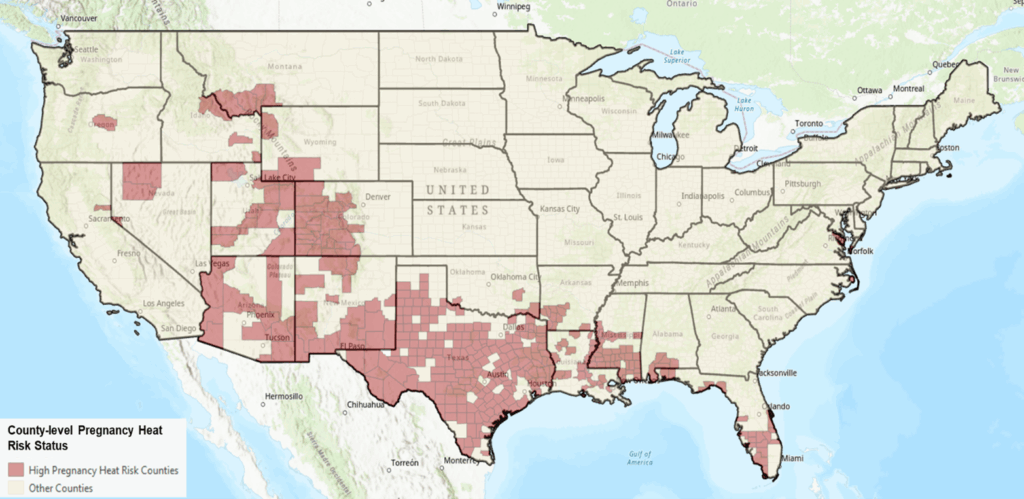
- High Pregnancy Heat Risk Counties: 379 counties (12.2%) are considered High Pregnancy Heat Risk areas. Over 186,000 births occur each year in these high pregnancy heat risk counties, representing about 5.1% of all births in the lower 48 states and DC.
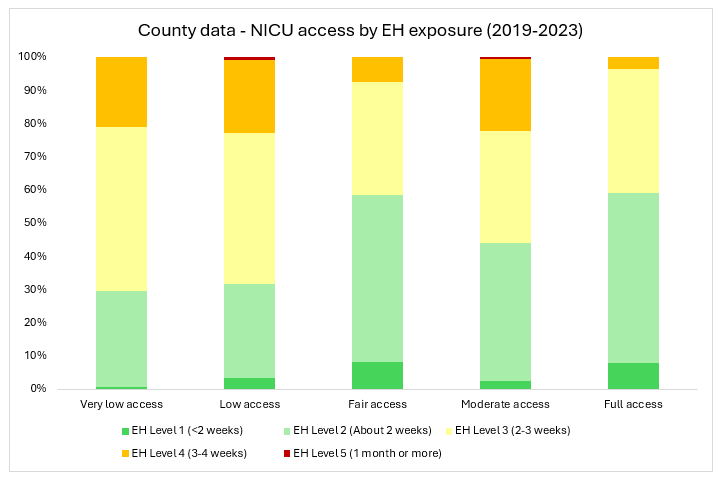
- Current Extreme Heat Exposures and NICU Access: Counties with Very Low or Low NICU access were more likely to have extreme heat exposures at Level 3 or higher, compared to counties with Fair, Moderate, or Full NICU access scores.
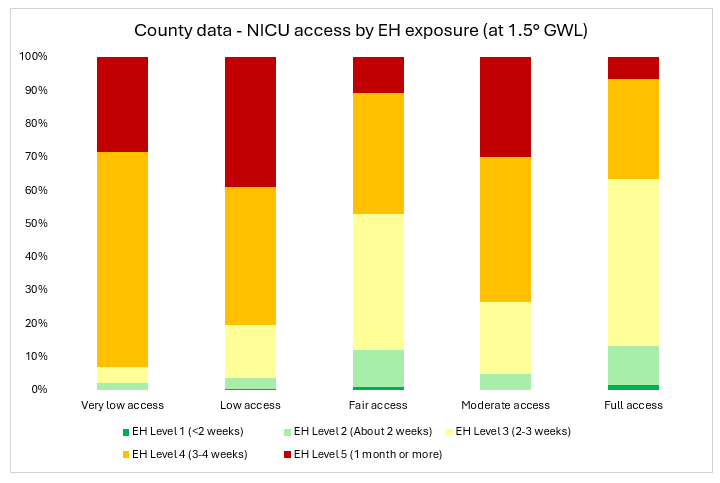
- Future Extreme Heat Exposures and NICU Access: When the earth reaches the 1.5° climate threshold, which could be as soon as the year 2040 {Di Liberto, 2024 #50}, many more counties will have Level 4 or 5 extreme heat exposure levels. Very Low and Low NICU access counties will be more likely to have Level 4 or 5 extreme heat exposure levels compared to counties with better NICU access levels.
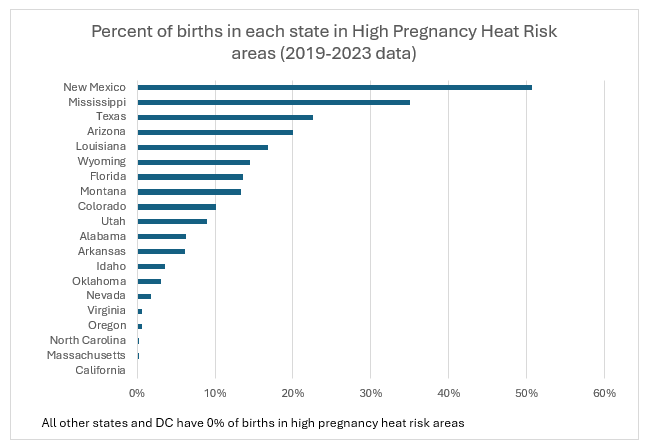
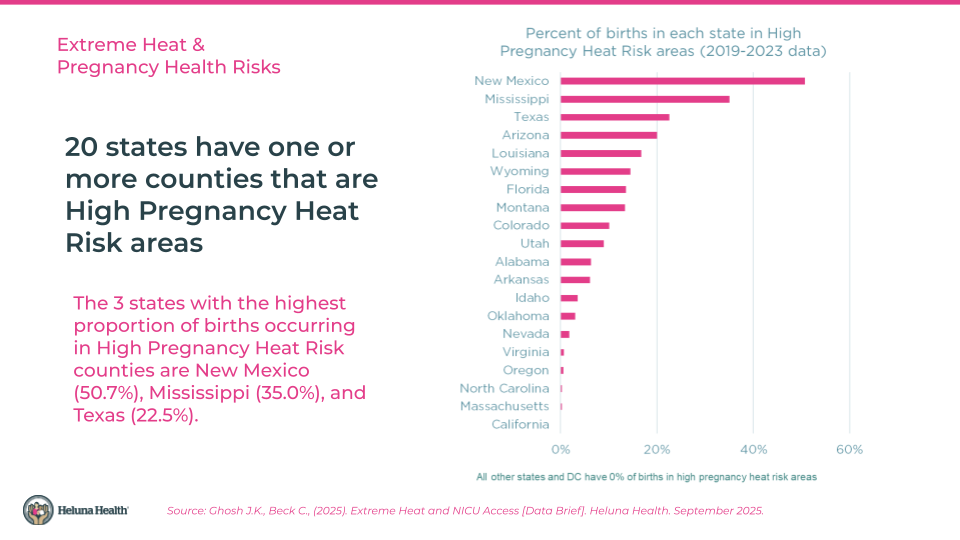
- States with the highest proportion of births occurring in High Pregnancy Heat Risk areas: There are 9 states that have 10% or more of their births occurring in High Pregnancy Heat Risk areas. These states are New Mexico (50.7%), Mississippi (35.0%), Texas (22.5%), Arizona (20.0%) Louisiana (16.7%), Wyoming (14.5%), Florida (13.6%), Montana (13.3%), and Colorado (10.1%). These are the geographic areas where heat illness prevention among pregnant people is widely needed.
- More states will experience High Pregnancy Heat Risk as the climate warms: Currently, 20 states have one or more counties that are High Pregnancy Heat Risk areas. When the earth reaches the 1.5° climate threshold, the number of states that will have High Pregnancy Heat Risk counties will grow to 37 states, assuming NICU access levels stay the same.
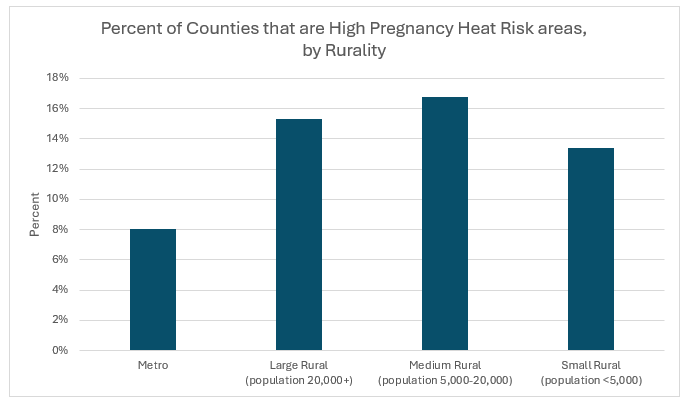
- Rural counties at higher risk: Rural countiesare more likely to be located in High Pregnancy Heat Risk areas compared to metropolitan counties. The proportions ofrural counties that are High Pregnancy Heat Risk counties range from 13.4% to 16.8%, compared to 8.1% of metropolitan counties.
- Lower socioeconomic status associated with higher risk: High Pregnancy Heat Risk areas have higher poverty rates and higher rates of adults over age 25 who do not have a high school diploma (data not shown).
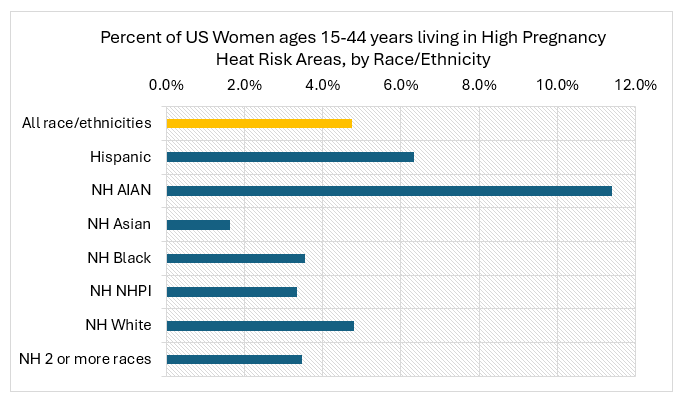
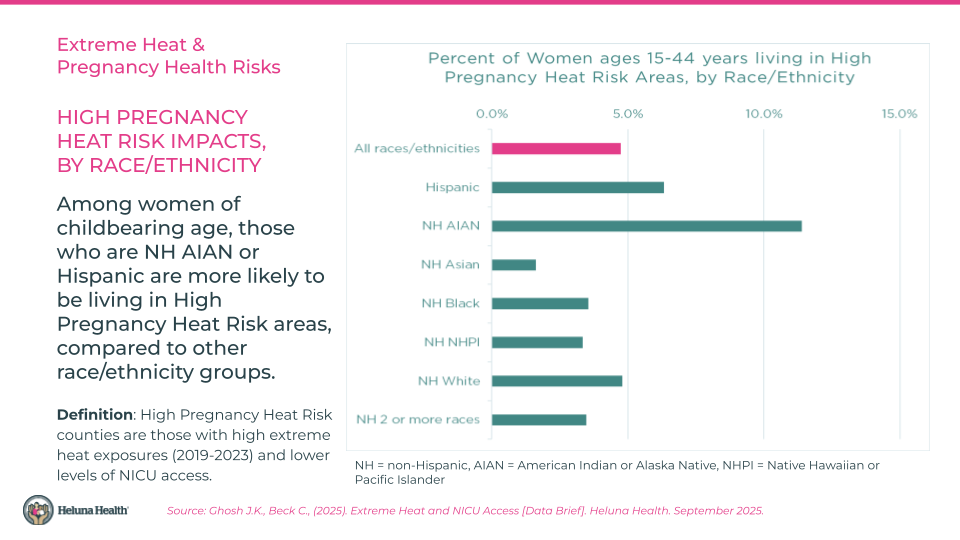
- Racial disparities in pregnancy heat risks: More than 11% of NH AIAN women ages 15-44 live in High Pregnancy Heat Risk areas. More than 6% of Hispanic women and nearly 5% of NH White women ages 15-44 live in High Pregnancy Heat Risk areas. Between 3-4% of women identifying as NH Black, NH NHPI, or NH of two or more races live in High Pregnancy Heat Risk areas, and less than 2% of NH Asian women live in these high risk areas.
Solutions and Resources
PREVENTION is key. Heat illness is highly preventable, but it takes knowledge, planning, and resources. Know the risks and actions you can take, make a plan with your family and healthcare provider, seek the resources that will help protect you and your baby from extreme heat impacts.
While this analysis focuses on identifying High Pregnancy Heat Risk areas, even one day of extreme heat can be harmful to a pregnant woman and baby. People living in areas where extreme heat is rare (such as the Pacific Northwest and New England) may not be prepared for extreme heat days. Access to cooling centers remains important to protect families in these areas.
Solutions and Resources – for pregnant individuals and families:
- Discuss and Develop a Heat Action Plan with your healthcare provider. Consider using the CHILL’D Out (https://www.cdc.gov/heat-health/media/pdfs/CHILLD-Out-Questionnaire-H.pdf) and a Heat Action Plan Template (https://www.americares.org/wp-content/uploads/ExtremeHeat_ActionPlanTipSheet_Final.pdf). Talk to your healthcare provider about any chronic health conditions and medications that may increase your risk of heat illness
- Know the steps you can take to prevent heat illness (APHA CEH Fact Sheet bit.ly/ExtremeHeatPregnancyHealthhttps://drive.google.com/file/d/1X6kiqHbccW9NXMc62pUNdjnDo1-rvsH4/view), and how to access resources (such as a cooling center, transportation, energy bill assistance, worker’s rights, etc.)
- Know where your closest NICU is located (https://nicudata.com/)
- Practice healthy prenatal behaviors, including attending prenatal appointments, eating healthy food, taking care of chronic diseases, and drinking water (https://healthcare.utah.edu/womens-health/pregnancy-birth/preterm-birth/10-ways-to-reduce-risk-of-another-birth)
- Grow your social support network – taking this step helps support your mental and physical health. Adapt social gatherings so you can avoid the heat – gather in air conditioned spaces, or consider moving gatherings to early morning or evening hours when the weather is cooler. Check in with one another to make sure you are staying safe and healthy from the heat (and other stressors)
Solutions and Resources – for healthcare providers:
- Provide environmental medicine training for obstetric clinicians and the perinatal workforce (doulas, midwives, CHWs) to discuss heat safety with clients [19], such as using the CHILL’D Out tool (https://www.cdc.gov/heat-health/media/pdfs/CHILLD-Out-Questionnaire-H.pdf) and developing a Heat Action Plan
- Integrate heat illness prevention education into medical and nursing school curricula (https://salatainstitute.harvard.edu/bringing-climate-change-into-medical-school/)[20]
- Provide training for neonatal emergency care in medically underserved areas, such as the STORK Training in Mississippi (https://everychildthrives.com/saving-lives-through-rural-emergency-training/) or the Neonatal Advanced Life Support training (https://www.redcross.org/take-a-class/organizations/healthcare-professionals/nals)
- Implement programs to prioritize transfer of mothers to hospitals with high-volume NICUs [21-24]
Solutions and Resources – for policymakers:
- Create Resiliency Centers in areas where residential air conditioning is limited (https://www.usdn.org/resilience-hubs.html, https://resilientcitiesnetwork.org/building-resilience-in-south-la-cafe-empowering-a-community/)
- Improve access to air conditioning and cooling centers, such as by supporting the LIHEAP program [25], free A/C programs [26] , and transportation vouchers or services to use to get to cooling centers (https://211arizona.org/#heat-relief-transportation)
- Consider policies requiring functioning cooling systems in rental units in higher heat risk areas (https://www.cabq.gov/planning/news/cooling-systems-now-required-in-all-rental-units)
- Improve access to health insurance, such as Medicaid expansion, and policies to provide insurance reimbursement for maternal transport to hospitals with NICU care [27]
- Increase cooling infrastructure, such as through green infrastructure, cool roofs, or cool pavements (https://fas.org/publication/shifting-to-resilient-infrastructure/), or incentivizing shifts toward energy efficient cooling systems (https://environmentamerica.org/center/resources/heat-pumps-how-federal-tax-credits-can-help-you-get-one/)
- Support strong OSHA heat regulations to protect workers (https://www.osha.gov/sites/default/files/publications/heat-rulemaking-factsheet.pdf)
- Tell EPA not to repeal the Endangerment Finding, so that we can continue to implement climate regulations that help slow the pace of global warming and protect public health (https://www.federalregister.gov/documents/2025/08/15/2025-15512/reconsideration-of-2009-endangerment-finding-and-greenhouse-gas-vehicle-standards-extension-of)
The following data slides are available for download:
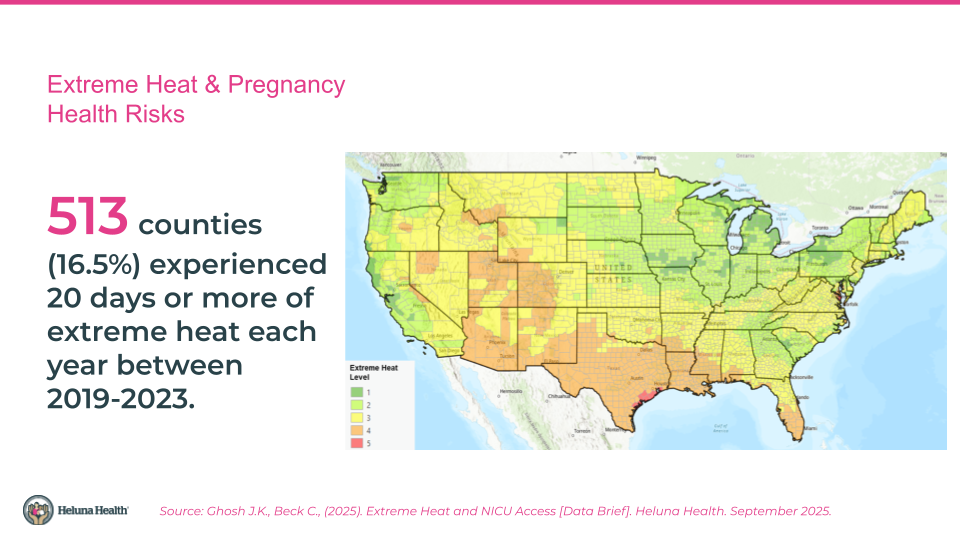
Map of counties by extreme heat risk
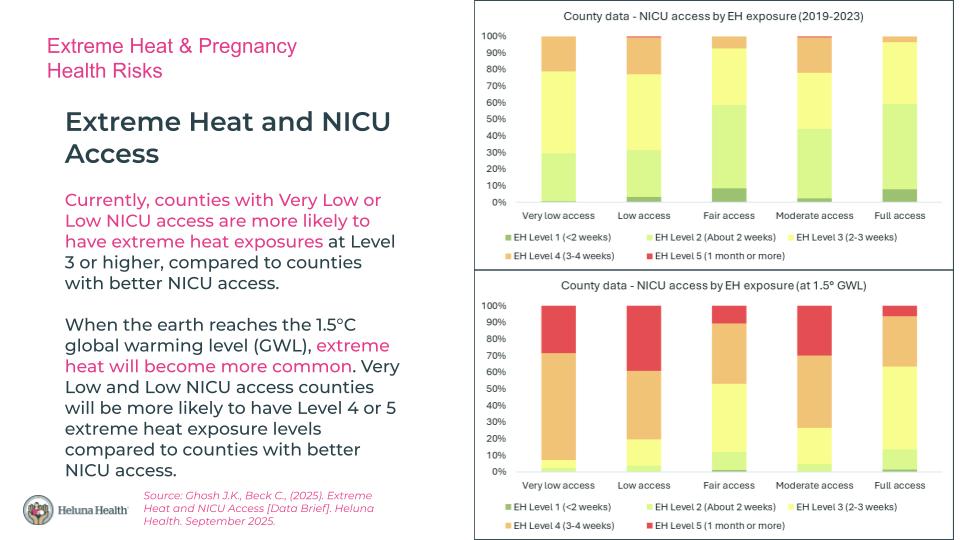
Extreme Heat and NICU Access
States with the highest percentage of births in High Pregnancy Heat Risk areas
High Pregnancy Heat Risk areas, by Rurality
High Pregnancy Heat Risk impacts, by Race/Ethnicity
Data Sources
We aimed to use the latest available data that was aligned across the measures included. For population and exposure data, we chose to use 5-year averages, where possible, to provide greater year-to-year stability.
| Measure | Data Source | Year(s) | Notes |
|---|---|---|---|
| NICU Activity and Location | NICUdata.com [28] | 2025 update | Restricted to Level III and IV facilities |
| County map | U.S. Census, Tigerlines | 2024 | |
| Neonatal staffing | National Plan and Provider Enumeration System (NPPES), National Provider Index (NPI) registry | January 2025 update | Included: Pediatrics (Neonatal-Perinatal Medicine), Nurse Practitioner (Neonatal), Respiratory Therapist (Registered, Neonatal/Pediatrics), Respiratory Therapist (Certified, Neonatal/Pediatrics), Registered Nurse (Neonatal Intensive Care), Nurse Practitioner (Neonatal, Critical Care), Clinical Nurse Specialist (Neonatal) |
| High risk births | CDC, NCHS birth data | 2019-2023 | Preterm or Low Weight |
| Uninsured women (ages 19-44) | U.S. Census, American Community Survey | 2023 (5-year estimates) | |
| Extreme Heat Days, historical and projected | CDC, National Environmental Public Health Tracking Tool [17] | 2019-2023 (current), 1.5° GWL (future) | County averages |
| Demographics | U.S. Census, American Community Survey | 2023 (5-year estimates) | |
| Rurality | USDA Economic Research Service, Rural Urban Continuum Codes | 2023 county estimates |
Methods
Geographic inclusion criteria: We restricted the analysis to the lower 48 states and Washington, DC because the extreme heat data were not available for Hawaii or Alaska.
County as unit of analysis: We acknowledge that counties are largely administrative boundaries and that climate conditions and health care access can vary substantially within a county. However, for the purpose of this analysis, we chose the county as the unit of analysis to provide some level of local granularity while also simplifying the data collection process. For example, the smallest geography that is provided in the NCHS birth data is the county. Similarly, some of the extreme heat measures were provided only at the county level.
Extreme heat definition: Although no standard definition of extreme heat currently exists, previous studies have found associations using percentile threshold definition of the Heat Index (a combined measure of maximum daily temperature and minimum relative humidity) and adverse health outcomes [29, 30]. The National Environmental Public Health Tracking Tool provides several set percentile threshold definitions of heat exposures in past years and we chose a 5-year average of days above the 95th percentile to capture days that were much hotter than typical compared to baseline. The site also includes modeled extreme heat measures based on GWL thresholds, but these modeled measures only include estimates of the number of days above a temperature threshold (rather than a heat index). We chose to combine these two measures to get a quantitative measure of the number of predicted heat days in this future scenario, but we acknowledge that this measure is imperfect and should be interpreted with caution. Because the state of Connecticut reorganized from 8 counties to 9 Planning Regions (https://www.ctdata.org/blog/geographic-resources-for-connecticuts-new-county-equivalent-geography) in the year 2022, we converted the county-level heat exposures to planning region-level heat exposures using land area-weighted averages.
NICU data: The dataset of NICU facilities was restricted to Level III and IV facilities and cleaned to remove duplicates and correct addresses for geocoding. Records were geocoded using Google Sheets Awesome Tables, and ESRI ArcGIS Pro was used to identify the county in which each facility is located and calculate distances from county centroids, using the NAD 1983 (2011) Contiguous USA Albers projection. NICUs located at military hospitals were included in the dataset, as these facilities are typically located in areas with a large number of military families who would likely use such healthcare services.
Neonatal staffing: We used the search term “neonatal” to identify taxonomies pertaining to neonatal staffing in the NPPES/NPI registry database, which includes all licensed healthcare providers in the United States. The following taxonomies were included in in the numerator count for neonatal staffing:
- 2080N0001X – Pediatrics – Neonatal-Perinatal Medicine
- 363LN0000X – Nurse Practitioner – Neonatal
- 2279P3900X – Respiratory Therapist, Registered – Neonatal/Pediatrics
- 2278P3900X – Respiratory Therapist, Certified – Neonatal/Pediatrics
- 163WN0002X – Registered Nurse – Neonatal Intensive Care
- 363LN0005X – Nurse Practitioner – Neonatal, Critical Care
- 364SN0000X – Clinical Nurse Specialist – Neonatal
We used the business mailing addresses in the NPI registry to identify the county where each provider was located. First, we took a ZIP code to county crosswalk from the U.S. Department of Housing and Urban Development’s (HUD) Office of Policy Development and Research (OPDR); ZIP codes that crosswalked to multiple counties were checked manually to determine the county in which the largest area of the ZIP code belonged. Remaining ZIP codes in the crosswalk were then geocoded in Google Sheets Awesome Tables (for ZIP code centroids) and then intersected with the county boundaries map in ArcGIS to identify which county they belonged in. This process created a file that we used to match the provider ZIP codes to their corresponding county. Unmatched ZIP codes were cleaned and rematched. Of the 13,294 providers identified in the 50 states and DC, there were 106 records that matched to multiple county FIPS codes; for these 106 records, we checked each delivery ZIP code on https://www.unitedstatesZIP codes.org/02760/ to identify the corresponding county.
To account for Connecticut’s reorganization to Planning Regions, for the 159 neonatal providers in Connecticut, we used a ZIP code to ZCTA crosswalk from HUD OPDR and then a ZCTA to planning region crosswalk provided at https://github.com/CT-Data-Collaborative/zip-to-planningregion/tree/main.
Birth data: For the purpose of this analysis, we considered any preterm (<37 weeks gestation, using the obstetric estimation) or low weight (<2500 grams at birth) infants a “high risk” birth that could potentially require a NICU stay. While many preterm or low weight newborns do not require NICU care, these are the two most common risk factors for NICU admission in the United States [31]. We used the NCHS data for live births occurring in years 2019-2023 to calculate the total number of births, number of preterm births, number of low weight births, and number of high risk (preterm and/or low weight) births for each county for each year. These numbers were averaged across the 5-year period; the 5-year average number of high risk births in each county was used as the denominator for the calculation of neonatal staffing rates (scaled to per 10,000 high risk births).
To account for Connecticut’s reorganizing to Planning Regions, we converted the birth counts from counties to planning regions using population-weighted averages of ACS 2023 5-year population under age 5 by census tract.
Rate of uninsured women: ACS 2023 5-year data on health insurance coverage are available by sex and age bins at the county (and planning region) level. The age bins most closely reflecting women of childbearing age were 19-25, 26-34, and 35-44 years, which is why we chose to use the age range 19-44 years for this indicator. Public health insurance through the Children’s Health Insurance Program (CHIP) is available for children under the age of 19 years, whereas adults aged 19 and older would no longer qualify for CHIP.
Demographics: ACS 2023 5-year data on race/ethnicity by sex and age was used to calculate the number of women ages 19 to 44 years, which is an approximation of the range of childbearing ages, given the age bins available in the data. The purpose of examining how these risks vary by race/ethnicity is to identify whether disparities by race/ethnicity exist, which may inform whether there are priority populations for prevention. For this purpose, we used a relatively groupings of race/ethnicity as follows; Hispanic or Latino of any race, non-Hispanic white alone, non-Hispanic black or African American alone, non-Hispanic Asian alone, non-Hispanic American Indian and Alaska Native (AIAN), non-Hispanic Native Hawaiian or Pacific Islander (NHPI), and non-Hispanic with two or more races. While these groupings are somewhat arbitrary and the “two or more races” category is an aggregation of many different groups, this simplified grouping gives an opportunity to view whether high-level disparities by race/ethnicity exist. The authors welcome recommendations for alternative race/ethnicity groupings. To identify areas with low educational attainment, we calculated the percentage of adults ages 25 or older who do not have a high school diploma. This definition has been used in other studies to identify areas with low educational attainment.[32] We used unadjusted logistic regression models to examine associations between the percentage of adults in the county with low educational attainment and the likelihood of the county being a High Pregnancy Heat Risk area.
Poverty: While poverty can be defined using a variety of thresholds, we chose to use a 200% federal poverty line (FPL) threshold to approximate the average income eligibility for Medicaid for pregnant women (in January 2025, the U.S. average was 213% FPL [33]). The definition of High Poverty as an areawide poverty rate of 20% or more is consistent with the U.S. Department of Agriculture Economic Research Service’s definition [34]. The definition of Concentrated Poverty is a simplified version of the definition provided by the U.S. Office of the Assistant Secretary for Planning and Evaluation (ASPE) [35], which defines a ZCTA as an areas of Concentrated Poverty if at least 30% of the residents are below the poverty threshold and the ZCTA contains at least one census tract with a poverty rate 40% or higher. Since a county is a much larger geography compared to a ZCTA, we simplified this definition to use only the 30% threshold to define Concentrated Poverty. The 2023 ACS 5-year data for population below certain poverty thresholds by age and sex were available for discrete age bins only, so we chose the age range of 15-50 for females to provide an estimate of poverty levels for women of childbearing age. We used unadjusted logistic regression models to examine associations between these poverty measures and the likelihood of the county being a High Pregnancy Heat Risk area.
Rurality: The 2023 Rural-Urban Continuum Codes (RUCC) provided by the USDA Economic Research Service were used to classify counties based on their overall level of urbanization or rurality.[36] The codes range from 1-9, with codes 1-3 representing metropolitan areas with different population sizes, and 4-9 representing non-metropolitan areas that are further grouped based on both population and whether or not they are adjacent to a metropolitan area. To simplify the groupings, we defined metropolitan as codes 1-3, large rural areas as codes 4-5 (population 20,000 or more), medium rural areas as codes 6-7 (population 5,000 to 20,000), and small rural areas as codes 8-9 (population less than 5,000). We used unadjusted logistic regression models to examine associations between county-level rurality and the likelihood of the county being a High Pregnancy Heat Risk area.
Methods
We are grateful to Dr. Joanna Mackie (Assistant Professor, University of Central Florida) and Dr. Keisha Callins (Professor, Mercer University School of Medicine) for their guidance on the project and on recommendations for calls to actions, and to Dr. Bobbi Pineda (Associate Professor, University of Southern California) for providing the NICU dataset and related guidance. We also thank Dr. Christopher Rogers (Associate Research Scientist, Heluna Health) for conducting data management to support this work.
References
- Bell, M.L., A. Gasparrini, and G.C. Benjamin, Climate Change, Extreme Heat, and Health. N Engl J Med, 2024. 390(19): p. 1793-1801.
- Khatana, S.A.M., R.M. Werner, and P.W. Groeneveld, Association of Extreme Heat With All-Cause Mortality in the Contiguous US, 2008-2017. JAMA Network Open, 2022. 5(5): p. e2212957-e2212957.
- U.S. EPA. Extreme Heat. 2025 August 22, 2025 [cited 2025 Sept 9]; Available from: https://www.epa.gov/climatechange-science/extreme-heat.
- National Weather Service. What is the heat index? 2025 [cited 2025 Sept 9]; Available from: https://www.weather.gov/ama/heatindex.
- Taheri, M., Millions of Americans Warned of ‘Dangerous, Life-Threatening’ Conditions, in Newsweek. 2025, Newsweek.
- Jiao, A., et al., Analysis of Heat Exposure During Pregnancy and Severe Maternal Morbidity. JAMA Network Open, 2023. 6(9): p. e2332780-e2332780.
- Lakhoo, D.P., et al., A systematic review and meta-analysis of heat exposure impacts on maternal, fetal and neonatal health. Nat Med, 2025. 31(2): p. 684-694.
- Mao, Y., et al., Associations between extreme temperature exposure and hypertensive disorders in pregnancy: a systematic review and meta-analysis. Hypertens Pregnancy, 2023. 42(1): p. 2288586.
- Konkel, L., Taking the Heat: Potential Fetal Health Effects of Hot Temperatures. Environ Health Perspect, 2019. 127(10): p. 102002.
- Speiser, M., Ishaq, M. , American Climate Perspectives Survey 2025, in Extreme Heat Is Harming Americans’ Health — And Communities Aren’t Ready. 2025, ecoAmerica: Washington, DC.
- Holcomb, D.S., et al., Geographic barriers to prenatal care access and their consequences. Am J Obstet Gynecol MFM, 2021. 3(5): p. 100442.
- Atwani, R., et al., Association of Maternity Care Deserts With Maternal and Pregnancy-Related Mortality. Obstetrics & Gynecology, 2025. 146(2).
- Climate Central, Climate change increasing pregnancy risks around the world due to extreme heat. 2025: Princeton, NJ.
- Khalique, A., Rising Extreme Heat Compounds the U.S. Maternal Health Crisis, in Policy Opportunities to Protect At-Risk Americans from Extreme Heat. 2024, Center for American Progress.
- Lasswell, S.M., et al., Perinatal Regionalization for Very Low-Birth-Weight and Very Preterm Infants: A Meta-analysis. JAMA, 2010. 304(9): p. 992-1000.
- Lorch, S.A., et al., The differential impact of delivery hospital on the outcomes of premature infants. Pediatrics, 2012. 130(2): p. 270-8.
- National Environmental Public Health Tracking Network, C.f.D.C.a. Prevention, Editor. 2025: Atlanta, GA.
- Stoneburner A, L.R., Fontenot J, Brigance C, Jones E, DeMaria AL., Nowhere to Go: Maternity Care Deserts Across the US. (Report No 4). 2024, March of Dimes.
- Atkin, K., et al., Educating Pregnant Women About the Dangers of Extreme Heat and Air Pollution. J Obstet Gynecol Neonatal Nurs, 2024. 53(4): p. 438-446.
- Wellbery, C., et al., It’s Time for Medical Schools to Introduce Climate Change Into Their Curricula. Acad Med, 2018. 93(12): p. 1774-1777.
- Neto, M.T., Perinatal care in Portugal: effects of 15 years of a regionalized system. Acta Paediatr, 2006. 95(11): p. 1349-52.
- Barnes, S.G., et al., Maternal Transport, What Do We Know: A Narrative Review. Int J Womens Health, 2024. 16: p. 877-889.
- Giragosian, L. Implementing Levels of Maternal Care Improves Access to Risk-Appropriate Care. 2024 May 28, 2024 [cited 2025 Sept 2]; Available from: https://www.astho.org/topic/brief/implementing-levels-of-maternal-care-improves-access-to-risk-appropriate-care/.
- Alliance for Innovation on Maternal Health, Strategies for Implementation of Regionalized Risk-Appropriate Maternal Care on a National Scale. 2022.
- LIHEAP.org. Low Income Home Energy Assistance Program. 2025 [cited 2025 August 27]; Available from: https://www.liheap.org/.
- Schmidt, S., No free A/C units through LIHEAP in Pennsylvania this summer, in WHYY.org. 2025, whyy.org: Philadelphia, PA.
- DeSisto, C.L., et al., Summary of neonatal and maternal transport and reimbursement policies-a 5-year update. J Perinatol, 2022. 42(10): p. 1306-1311.
- Pineda, R., et al., NICUs in the US: levels of acuity, number of beds, and relationships to population factors. J Perinatol, 2023. 43(6): p. 796-805.
- Jiao, A., et al., The role of extreme heat exposure on premature rupture of membranes in Southern California: A study from a large pregnancy cohort. Environ Int, 2023. 173: p. 107824.
- Jung, Y.S., et al., Extreme heat and hospital admissions in older adults: A small-area analysis in the Greater Boston metropolitan area. Environ Epidemiol, 2025. 9(3): p. e395.
- Martin, J.A. and M.J.K. Osterman, Increases in neonatal intensive care admissions in the United States, 2016–2023. 2025, National Center for Health Statistics.
- Office of Environmental Health Hazard Assessment. Educational Attainment. [cited 2025 Sept 2]; Available from: https://oehha.ca.gov/calenviroscreen/indicator/educational-attainment.
- Medicaid and CHIP Income Eligibility Limits for Pregnant Women, 2003-2025. 2025, Kaiser Family Foundation.
- Economic Research Service. Poverty Area Measures – Background and Uses. 2025 2/10/2025 [cited 2025 Sept 2]; Available from: https://www.ers.usda.gov/data-products/poverty-area-measures/background-and-uses.
- Meade, E.E., Overview of Community Characteristics in Areas With Concentrated Poverty. 2014, Office of Human Services Policy: Washington, DC.
- Economic Research Service. Rural-Urban Continuum Codes. 2025 1/7/2025 [cited 2025 Sept 2]; Available from: https://www.ers.usda.gov/data-products/rural-urban-continuum-codes.